Keep up with our latest news and projects!
In my research, I investigate urban livability and the quality of the human-environment relationship in different contexts (such as mobility, health, urban parks, large planned events, economic development). My general objective is to bridge the gaps between theory and practice, by providing constructive results through theory-driven assessment and analysis.
Urban livability represents how well the needs and expectations of the residents are fulfilled by urban form and urban functions. One of the most important aspects in this regard is how accessible basic functions (such as shopping facilities, workplace etc.) are. Ideally, the necessary functions which are appropriate in terms of the residents’ needs are accessible in the neighborhood where they live, preferably by walking or cycling. In the case of longer distances public transport should be a competitive alternative to cars with similar travel time and fewer unnecessary changes between different lines. Due to the individual characteristics regarding human needs and the subjectivity of the perception of the people, it is difficult to state anything about the livability of a given place as ground truth. Obviously, there are objective characteristics of a city (such as crime rates, demographical statistics, infrastructure-related metrics) but they are not directly usable as factors in livability assessment where the goal is to describe the relationship between human needs and the functionality provided by the environment, and to what extent these needs are fulfilled.
In terms of planning that aims to improve city quality, the assessment of existing conditions is an essential and intermediary step in the way I analyze urban livability. This specific analysis helps to determine what is present in the urban environment and what the needs and expectations of the users of that environment are.
In the case of walkable and human-scaled places, we know a lot about their benefits (on health, environment and economy) but to identify where and what kind of changes are necessary in order to improve walkability and human-scale is really challenging due to the complexity of cities. If planners intend to know WHY some places are less attractive for pedestrians or HOW the number of trips using a car can be reduced by making other transportation modes competitive and more attractive – it needs a holistic view by handling the whole city as a system. That is where the role of the assessment gets clear and unequivocal. With the factors that are representing the necessary characteristics systematically, planners can identify relationships, causes and effects between different factors and elements. For instance, the investigation of the perceived safety and how it is related to the time spent outside, or the connection between encounters and trust in a neighborhood and how it is influenced by urban form. Based on the results of site-specific analysis of these factors, planners can define the relationship of humans with their environment and identify what is missing in order to achieve higher walkability and livability or how changes in this system would affect the existing conditions.
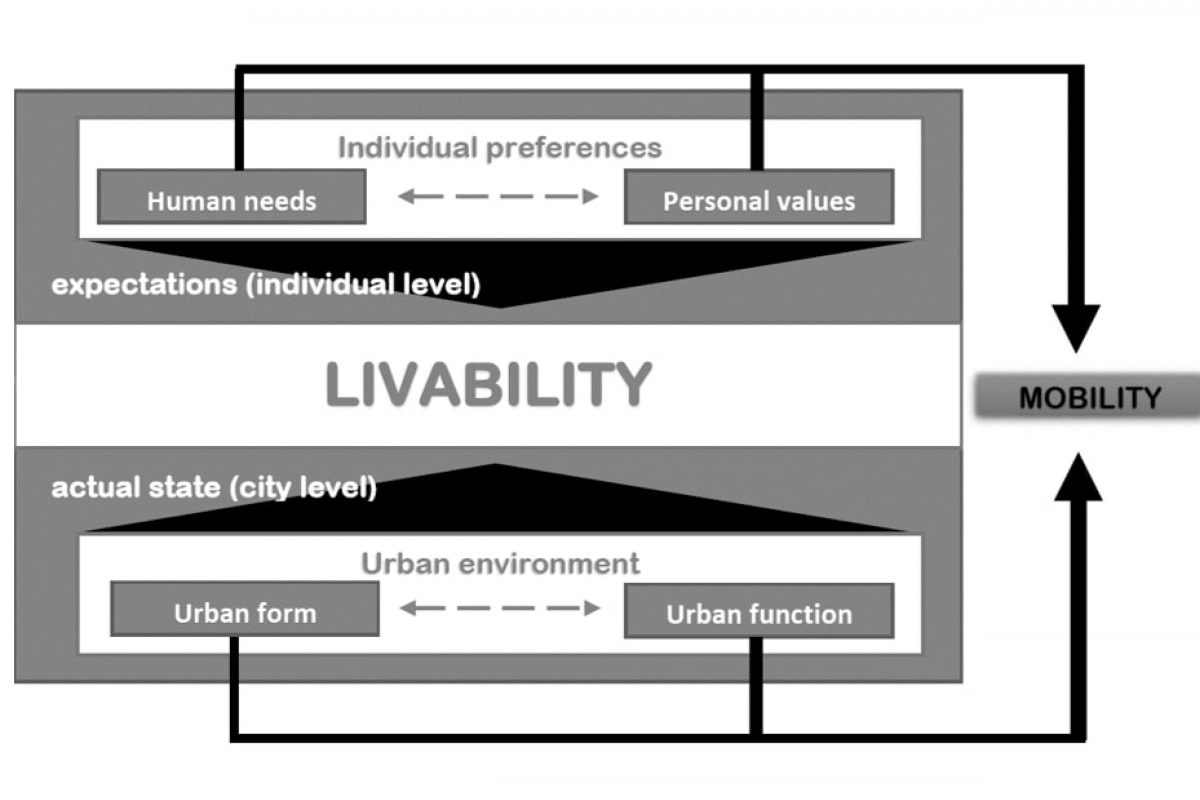 General representation of urban livabilityliv_gen
The purpose of these understandings and assessments would be, as the quote says above, to create strategies for development of public spaces where people can and want to spend more time than just simply passing by. Walkability and human scale are some of the key aspects in my approach, as they especially focus on the pleasurable environment which reflects the subjective perception of the people through measurable factors as well. In the human scale concept and walkability such factors are the streetscape and edges (plinths), building height and density, perceived safety, reduced traffic, etc.
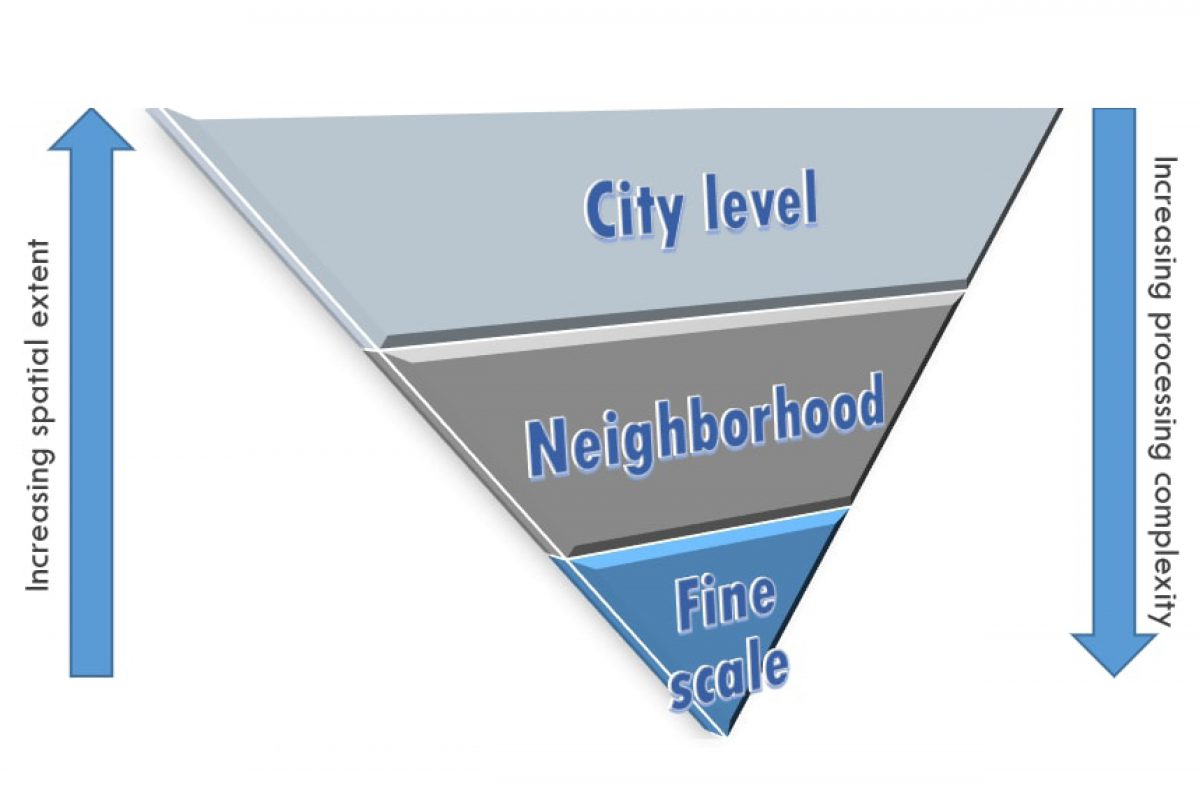
In urban livability analysis, three different spatial scales can be identified:
City scale for phenomena or characteristics which have an effect on the whole city (as macro-scale) such as climate, topography, cultural facilities, airports, hospitals etc.
Neighborhood-level as mezo-scale, mostly related to the accessibility of various urban functions such as shopping, recreation, and other free time activities.
Micro-scale is the finest level to look at, usually within the range of eyesight and connected to the human-scale (e.g. plinths, streetscape, aesthetics, street furniture, storefronts, urban fabric)
The third one (micro-scale) is usually the most relevant regarding aesthetics and other factors attracting people to spend more time outdoors in public spaces. However, the analysis of this fine scale needs completely different methods and data compared to the other two, which is usually not so easy to acquire. While macro- and mezo-scale analyses are mostly related to accessibility of specific factors, the micro-scale should represent the urban form and also how it is perceived by the people. Traditional spatial analysis (and data collection) is, unfortunately, less appropriate for the latter as it needs data in higher resolution and usually in three dimensions and thereby the existing analysis methods are not appropriate to illustrate the perception of people either. For example in the case of walkability analysis, data on the characteristics of sidewalks for a whole city are usually not available, especially not with the information on the ground floor of the buildings or smaller objects on the street such as benches or curbs. Collecting such detailed data with existing methods is currently time- and resource-consuming and often the reliability is also lower.
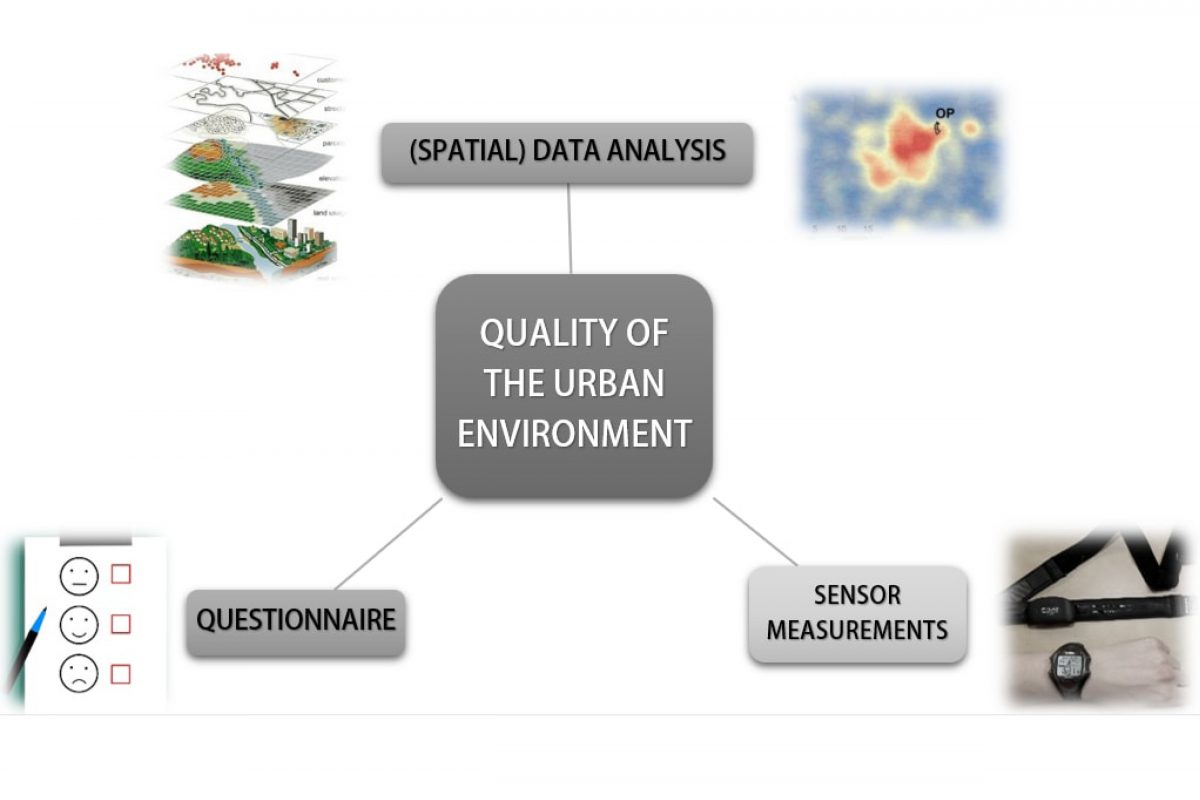
To bridge this gap, currently we are working on a framework, which consists of three different sources: sensory data, questionnaires and real spatial data on sidewalks, storefronts etc. Spatial data provides the appropriate input for answering the previously mentioned of ‘what is already there’ whereas with sensory data (such as identifying ‘emotions’ through physiological measurements e.g. heartrate, skin-conduction, temperature, etc.) and questionnaires we can trace the more subjective aspects regarding needs and feelings in different ways and contexts.
While the country politicians give speeches about national identity, architects build spaces for the public realm to find their common bounds. And some architects even do it from the eye level of kids. TPS offers children the empowerment to create their spaces to play and feel safe. Plus it also offers grown-ups the opportunity to be the right role model who attends, votes and helps building their community.
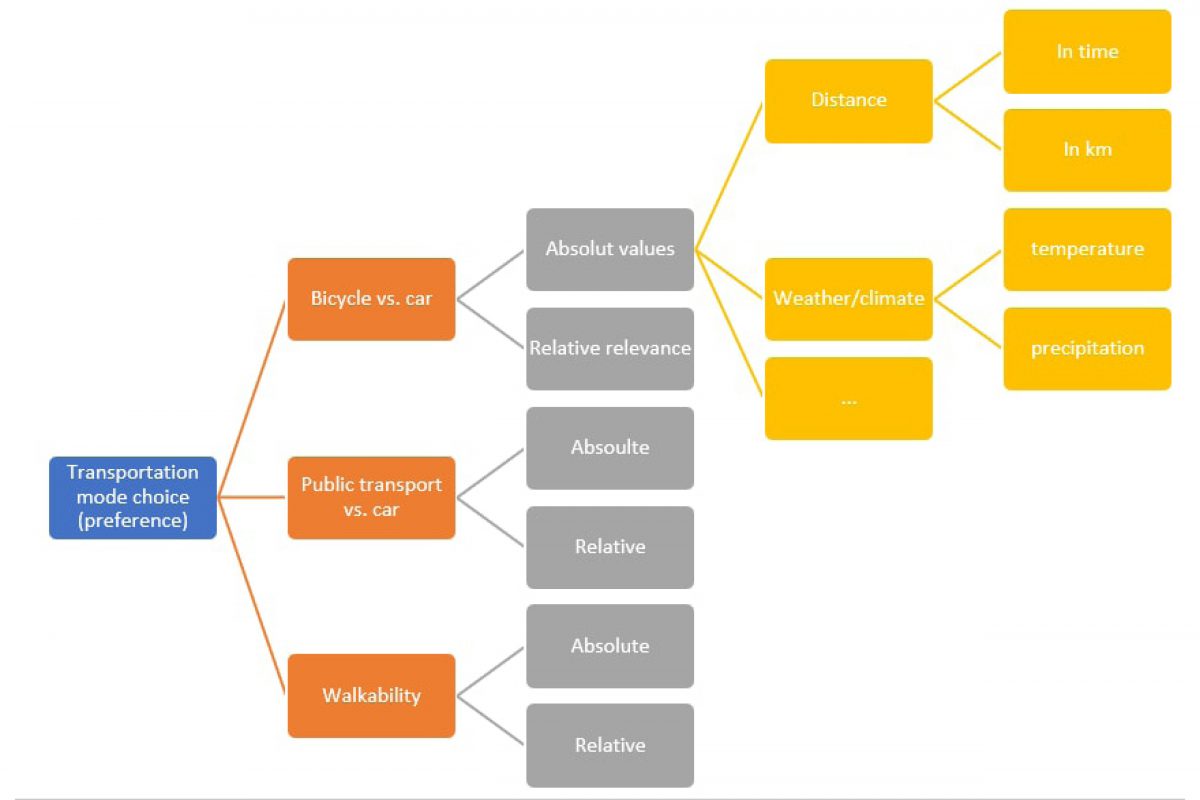
Supporting the real needs of people living in cities we are also setting up a crowdsourcing tool to get detailed information on individual factors and proof on the relevance for statements about mobility choices people make (passive versus active transport). The main factors are the weather and topography conditions, distance, the frequency of traffic jams, (perceived) traffic safety, infrastructure, health effect, and aesthetics among others. In the first step, the range of each value is assessed (e.g someone would use a bicycle during the summer when it is not raining but not during the winter in cold temperatures, or someone would only drive a car if the frequency or duration of traffic jams is lower than 2 hours weekly). While in the second part, the relative relevance of each factor should be investigated through pairwise comparisons of factors (which one is more important for someone when choosing to ride a bicycle: to have good weather or significantly shorter travel time compared to driving a car).
We hope that both tools can aid planners in their practical work by enhancing the efficiency of planning projects aiming better quality in the near future.
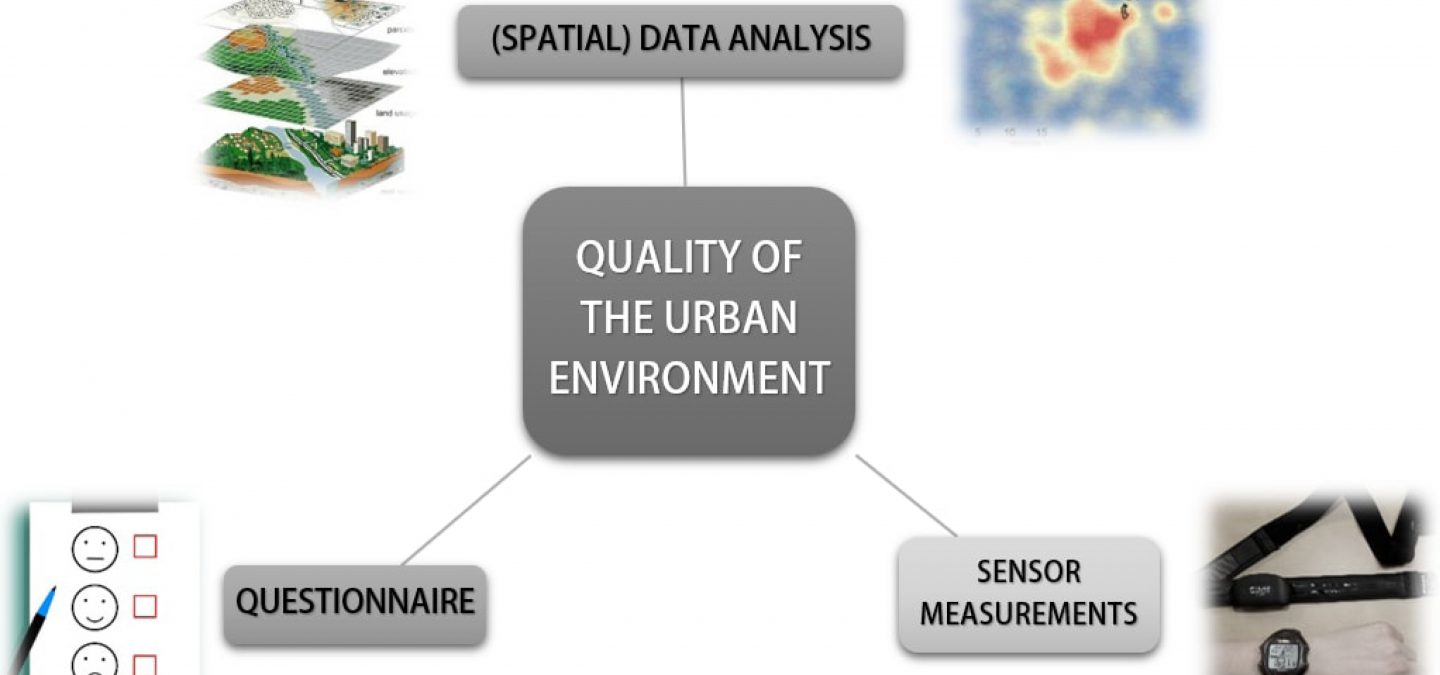
Steps of our urban livability analysis:
A. (spatial) data analysis
B. sensor measurement
C. questionnaire
D. crowdsourcing tool
Possible limitations and risks:
 Scheme of the analysis frameworkcomplex
Interested? Join The City At Eye Level and share your story!
Discover more